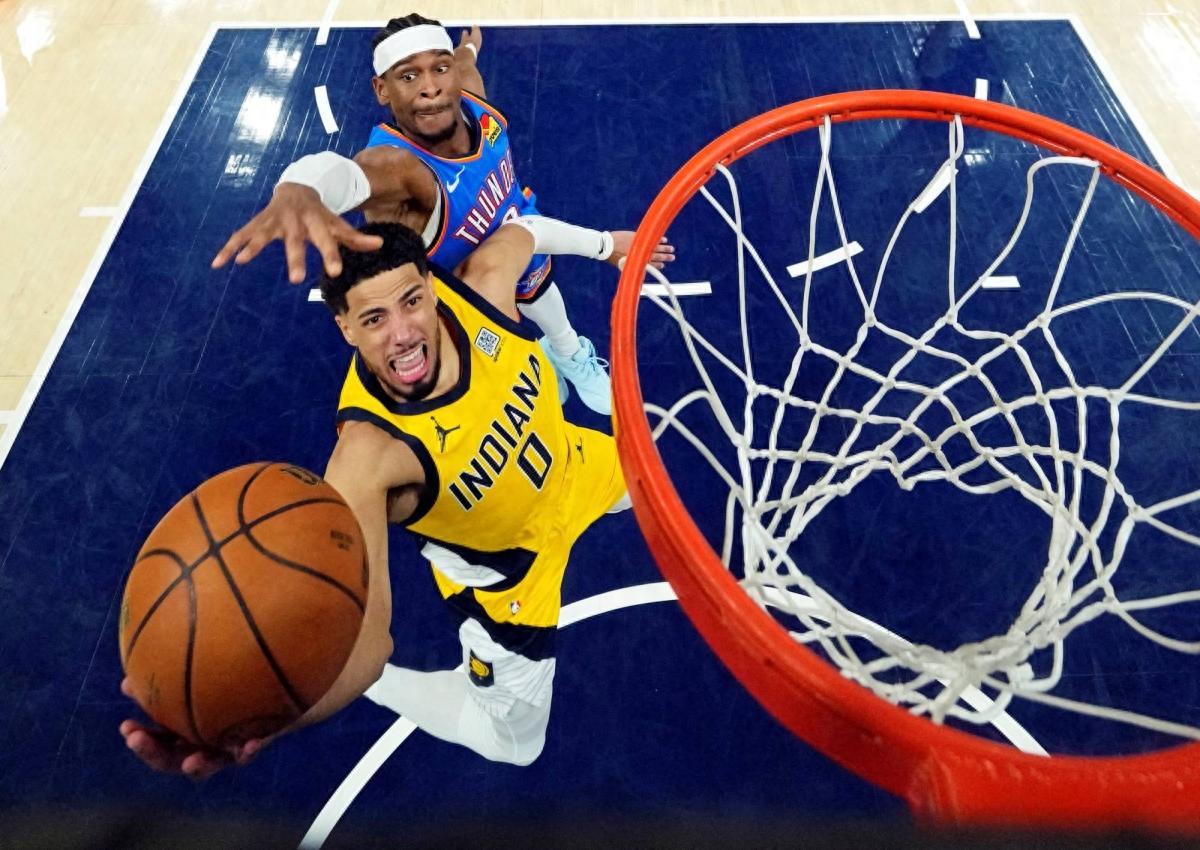
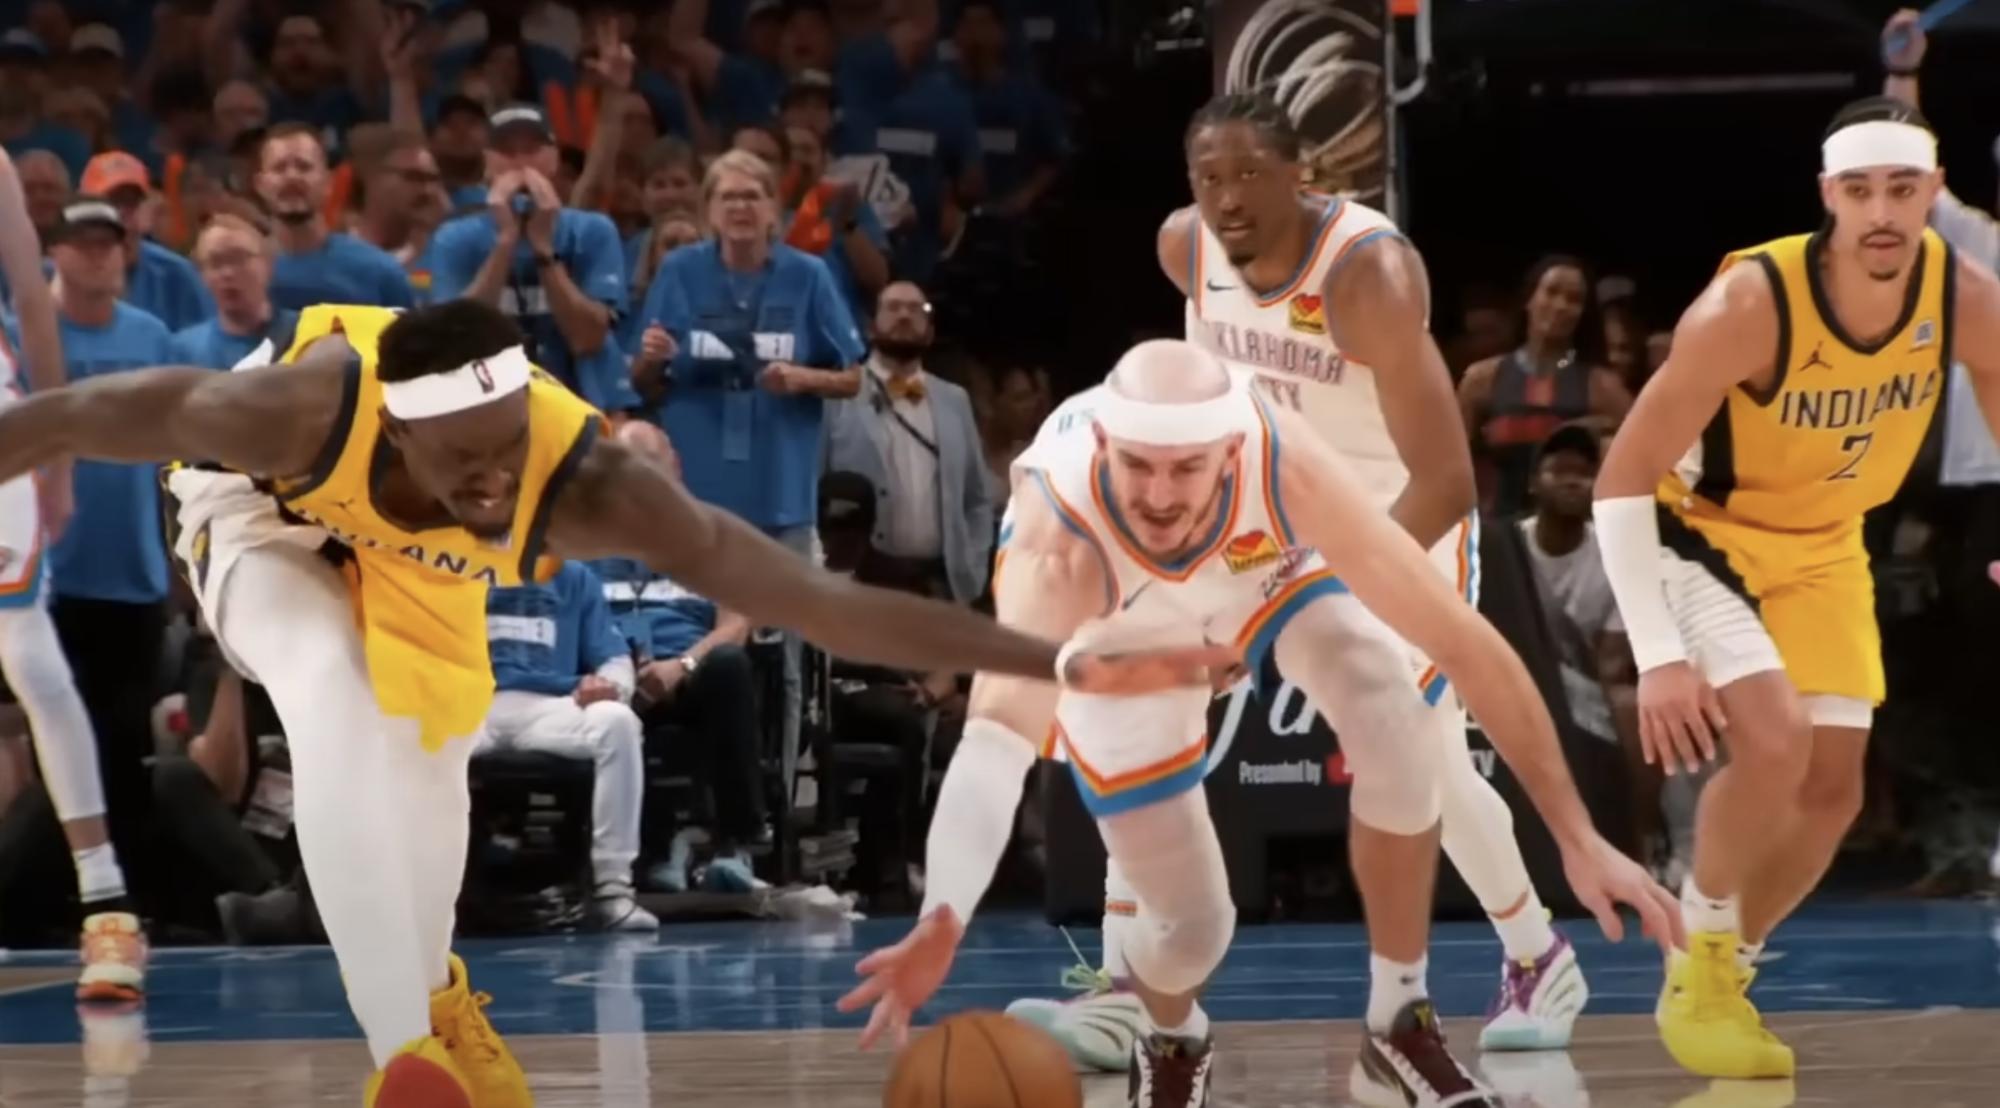
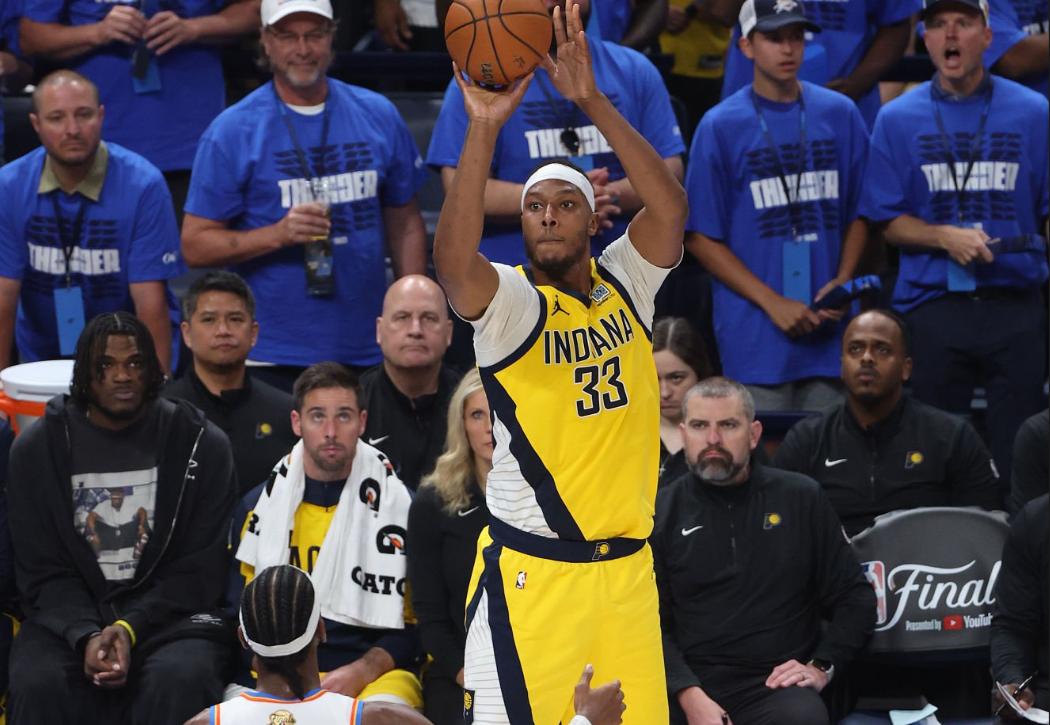
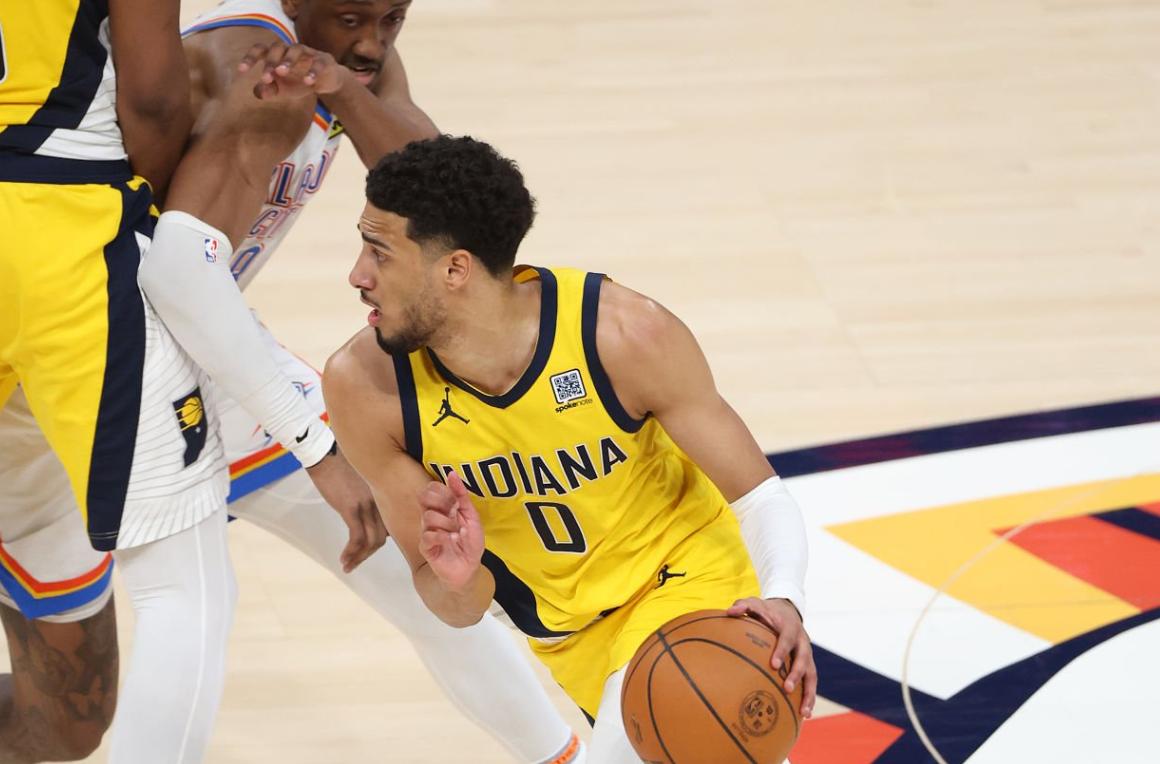
On June 19, Beijing time, NBA.com analyst John Schuhmann offered insights from a statistical perspective regarding the 2024-25 Finals. The Thunder are one victory away from securing their first championship in Oklahoma City’s history, while the Pacers, playing at home in Game 6, aim to extend the NBA Finals to a Game 7 for the first time in almost nine years. Here are ten noteworthy statistics to consider during the Finals—

598 passes
According to tracking data from Second Spectrum, the Pacers made an astonishing 598 more passes than the Thunder in the first five games, averaging 120 more passes per game. Ball movement has always been central to the Pacers' offense, while the Thunder's aggressive defense forces opponents to pass the ball more often than usual—during every 24 minutes of possession, the Pacers completed 386 passes, setting a postseason record for any round this season.
In contrast, the Thunder's Shai Gilgeous-Alexander and Jalen Williams combined for an average of 58.2 points per game, but only 21% of their field goals in the flow of play came from assists.
31 opportunities
In the five games, the Thunder had 31 more shooting opportunities (field goals in play + free throws) than the Pacers. Although the Pacers had a higher shooting efficiency, with a true shooting percentage of 58.3% compared to the Thunder's 57.1%, the Thunder excelled in possession battles: they committed 26 fewer turnovers and grabbed 9 more offensive rebounds. So far in the series, the Pacers only had more shooting opportunities than their opponents in Game 3, which they won.
229 steals

The Thunder have recorded 229 steals (opponent's live-ball turnovers) in the playoffs, at least 23 more than any team since steals have been tracked for 52 years. However, the team's leading thief, Alex Caruso, with 42 steals, ranks only 27th on the individual leaderboard during this period.
110.1 points
Excluding the last regular-season game (when Haliburton and Siakam were absent), the Pacers averaged 110.1 points per 100 possessions during the Finals, marking the lowest offensive performance in the five games since the All-Star break. Despite having a true shooting percentage of 58.3%, which is higher than the Thunder's, it is the lowest among all playoff rounds; their turnover rate (18.7 per 100 possessions) also reached a significant high.
14.0 points
Defense has become crucial: in the three wins for the Thunder, they averaged 120.4 points per 100 possessions, which is 14 points more than the 106.4 points they averaged in the two losses. This is attributed to differences in free throw rates (40.6 free throws per 100 shots vs. 30.5) and offensive rebound rates (36.4% vs. 28.3%), as well as shooting efficiency.
65 points

The Thunder outscored the Pacers by a total of 65 points in the paint (+34 points) and from the free-throw line (+31 points), while the Pacers scored 41 more points than the Thunder in non-paint field goals.
14.5 points
During the 60 minutes Haliburton was off the court, the Pacers had a net negative of 14.5 points per 100 possessions. In Game 5, where he was affected by a calf injury, it was the first instance in the series where the Pacers significantly trailed while Haliburton was on the floor. Although both teams have decent bench depth, the Thunder's bench efficiency is significantly better than that of the Pacers.
49.1%

The Pacers shot 49.1% from the corners in the Finals, making 11 more corner threes than the Thunder, but they attempted only 5 in Game 5, the fewest of the series. Their shooting percentage from the top of the arc was only 31.3%, the worst of the four playoff rounds, significantly down from 39.8% in the first two rounds.
17.4%
Data from Second Spectrum shows that both teams combined for only 12 successful three-pointers out of 69 attempts (17.4%) in the last 6 seconds of their offensive possessions. In Game 5, the Thunder finally activated their fast break, but the Pacers' average fast break points fell from 25.8 in the first three games to 15.4. When forced to wait until the end of the shot clock, the Pacers had a shooting percentage of only 25.5% (with 7 threes out of 47 attempts), while the Thunder also struggled at 28.6% (5 threes out of 22 attempts), but faced this situation less frequently.
0.63 points

Second Spectrum's data indicates that when the Thunder switched on pick-and-rolls involving Haliburton, the Pacers generated only 0.63 points per opportunity (24 points from 38 opportunities); whereas when the Thunder used other defensive strategies on pick-and-rolls, the Pacers scored 0.92 points per opportunity. The switch limits the Pacers' ball movement and forces Haliburton into isolations—during which he only scored 0.45 points per isolation (9 points from 20 attempts), lower than his 1.16 points average in the first three rounds.


 网站地图
网站地图
 联系方式
联系方式
 应用下载
应用下载


